Stress Test Subgroup

Testing resilience and evaluating performance under supply chain pressure scenarios

Overview

Visual representation of the semiconductor supply chain digital twin framework and its interconnected components
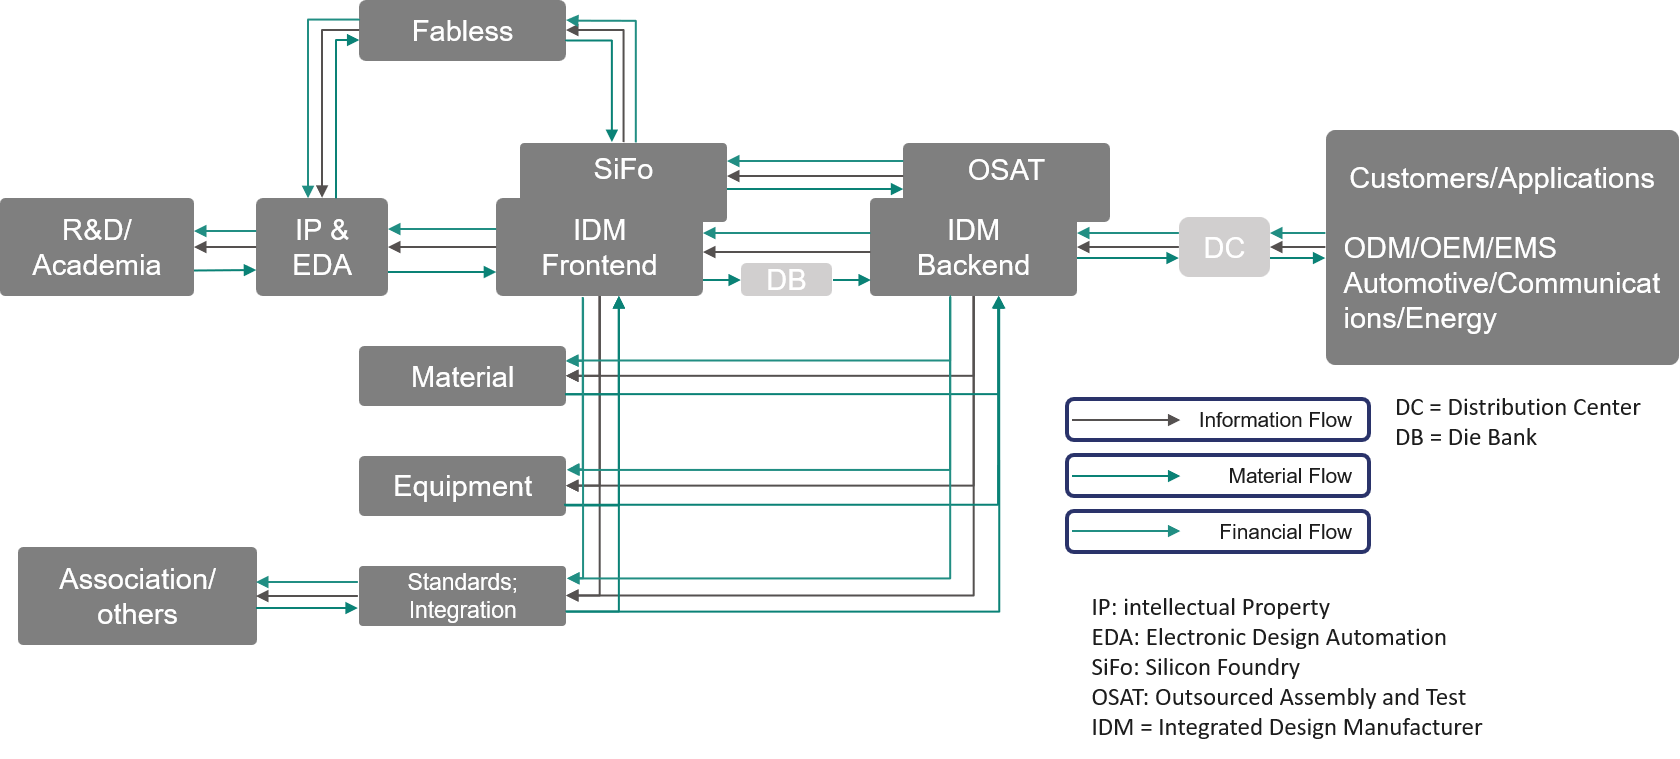
Digital Twin Semiconductor Supply Chain

Current Work Progress

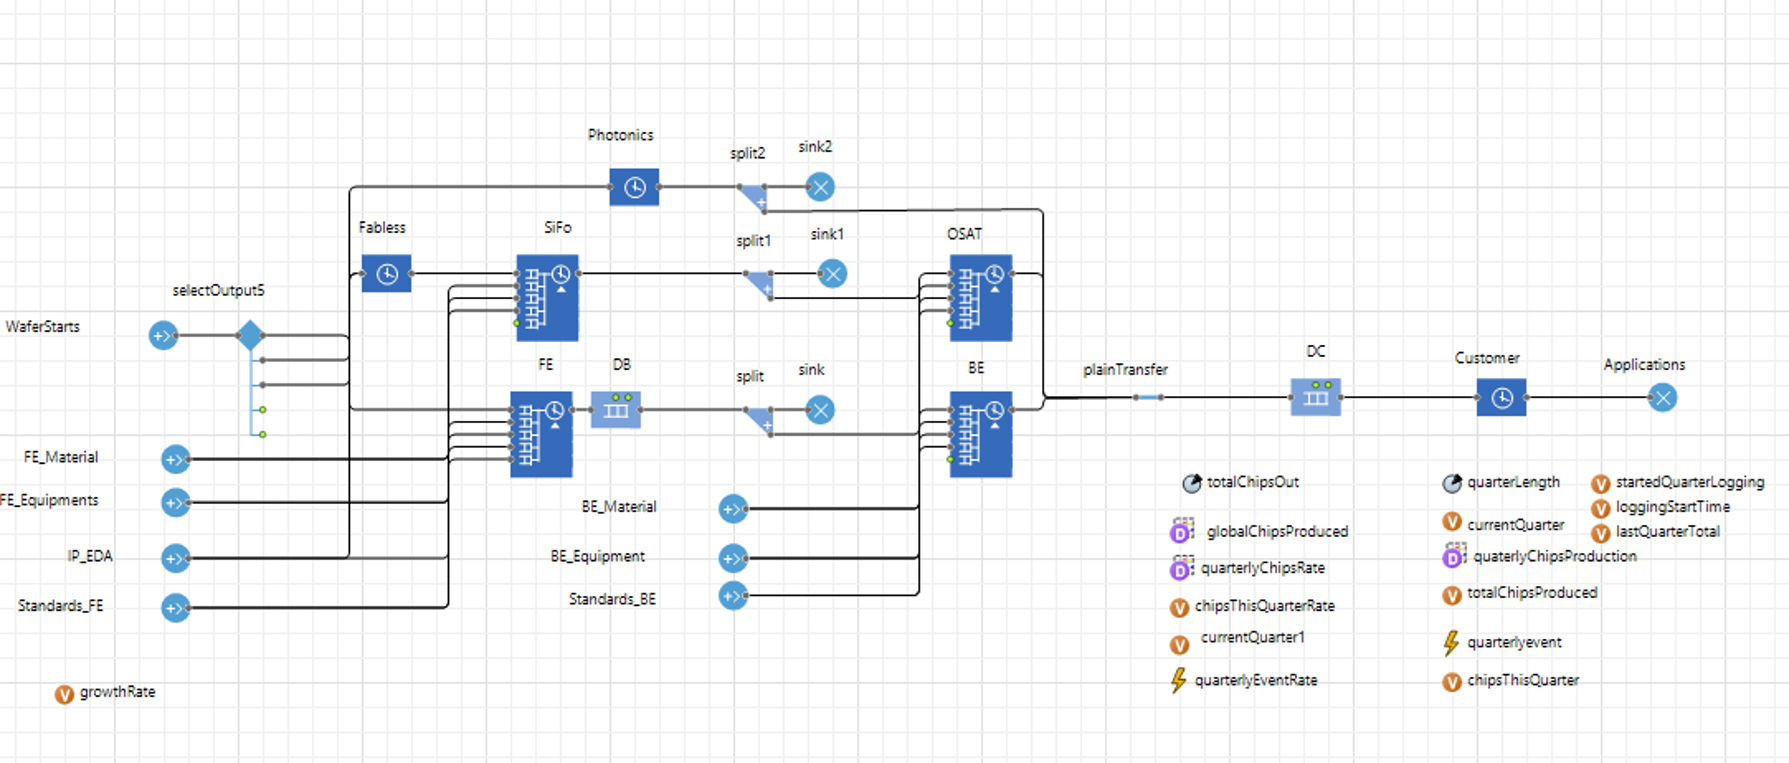
AnyLogic Implementation Diagram
📋

Assumptions

  • Simulation runs for 60 years (3120 weeks)
  • Wafer Start: 2 million wafer (back in 1965)
  • Wafer production: 1 billion (in 2025)
  • Yearly growth rate: ~11% / Year
  • Total Chips productions (25): 500 billion Chips
  • FE/SiFo cycle-time: 16 Weeks
  • BE/OSAT cycle-time: 3 Weeks
  • Photonics cycle-time: 19 Weeks
  • We need system dynamics – cause effect simulation and Match box Option – planned ATP & physical goods to be available for shipping
🎯

Next Steps for Validation

  • Confirm total production of 1 billion Wafer in 2025
  • Build up all regions (EU, Taiwan, United States, South Korea, China, Japan)
  • Add Reports & KPIs like Gross Margin
  • Add interactions between regions
  • Add more products (three) in different nodes (three)
  • Include capacity constraints
  • Model all 12 building blocks with impact like cost, cycle time increase/decrease
  • Validation on historic chances & risks & add what is needed
  • Japan rise and fall
  • Sematech
  • .com crisis; financial crisis; Corona crisis
  • Insolvency of Quimonda
  • Rise of china
  • Nexperia